I love Instagram. I love social media in general – Twitter, Tumblr, Snapchat, Facebook, the list goes on – they’re all great in their own way. But Instagram is an obsession. Because of this, I was all over Instagram the moment I heard about it. My Instagram user ID is just over 5,300. I’ve never had a big following though – I’ve been around 300 followers for a while.
Late last year we began developing our Instagram analytics at Union Metrics. I was so excited when they were ready. Finally, I could understand how my Instagram account is actually doing! Since then I’ve been eating our dog food by using our analytics to help me do better on Instagram. And our dog food has always been tasty. But in the past month, it has gotten so much tastier.
As you may have seen, at Union Metrics we just launched an update to our pro Instagram analytics, along with a brand new free Instagram account checkup. Among these updates were the addition of our new insights, which tell you what to pay attention to in your metrics, and recommendations for what you can actually do based on those numbers. During the month of November, I took our advice and made changes to what and how I was posting to Instagram. And like a good scientist, I have numbers to support this, and I thought it would be interesting to share what I did. You can see my Union Metrics report here.
Content and hashtags
I’ve been using Instagram since October 2010. In those four years, I’ve learned a lot about what gets likes and what doesn’t.
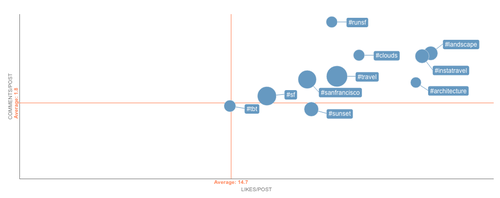
On Instagram, a hashtag represents a community. Different communities respect different kinds of content. For me – an unabashed acolyte of the #landscape hashtag – I’ve had the best success with nature and travel photos. My most effective hashtags are things like #instatravel, #landscape, #travel, #sanfrancisco, #architecture, and a personal favorite, #runSF. The photos and occasional video I post with these hashtags perform way higher than my historical averages. This is because a) thousands of Instagram users are always monitoring their favorite hashtags and b) I’m creating content that fits in well in those communities. I also pay attention to those and related hashtags, learning what others post, finding new Instagram accounts to follow, liking and commenting on images I find particularly inspirational.
For me, photos with regular people in them (a.k.a., my friends and family) just don’t perform as well (sorry, guys!). My photos of sunsets are off the charts, though. And Instagram loves my photos of celebrities, because the internet.
So now that I know what works well on Instagram, I’ve been posting lots more content like that. Results below.
When to post
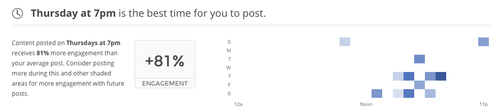
Previously, I posted mostly on weekends. But it turns out I get a lot more non-follower engagement on weeknights, particularly in the 6-8pm hours (PT) toward the latter half of the week. So I’ve started to post more during the week to try to reach those audiences when they’re most active. Here’s a heat map of when my content gets the most engagement.
Followers
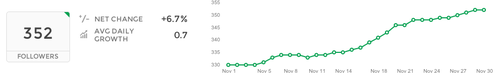
Like I said earlier, I never had that many followers. I only broke 300 followers earlier this year. Like many personal Instagram accounts, my average monthly follower growth was pretty low – I would get a few new followers here or there, as new people downloaded the app or somehow stumbled upon my account. I had an average follower growth rate of about 1% per month through October 2014. Not bad, but certainly not great.
But after I made some of the changes I’ve talked about here, my followers grew by 6.7% in November. That’s a tremendous increase for me – I gained more followers this month than I did in the ten previous months combined. Look at this growth rate! If this was a startup, I would invest in it.
Engagement
The holy grail of Instagram metrics is engagement. We all want more likes and comments on our posts. In 2013, I averaged an abysmal 7 likes per post. I’ve had a few lucky posts that reached 20 or 30 likes (thanks, JLaw!), but historically, most of my Instagram posts got 6-12 likes through the first half of this year.
This month, I averaged 29 likes per post, with some of my most popular photos hitting highs of 40 likes or more. That’s 4x my earlier engagement levels. In all years before this, my average likes per post increased about 50% per year. There’s still a month left in 2014, but I’ve already seen a 300% increase in likes per post year-over-year.
Fans
Last year, 203 unique people interacted with my photos at least once. A year earlier in 2012, it was 163 people. This year, I’m already up to 905 unique participants, 373 of which have been in November alone. More different people interacted with my content this month than did all of last year. My total fans are up 345% year-over-year.
In summary,
- My followers grew by 6.7% in November, up from 1% per month on average previously. I gained more followers this month than I did in the nine previous months combined.
- I’m averaging 29 likes/post this month, which is a 300% increase in likes per post year-over-year.
- The number of unique people who have interacted with my content is up 330% so far this year. More different people have interacted with my content this month than did all of last year.
Anyway, your results may vary, but I’ve been floored by what a few small changes to what and when I post , and the hashtags I use, have done to my Instagram engagement. Give it try – I’d love to see what you learn.
And the requisite plug – you can use our free Instagram account checkup tool here anytime you want to see how you’re doing. And I’d love to be friends on Instagram – you can find me at http://instagram.com/jdeeringdavis.


 So, after thinking the CES Tracker was so compelling, I couldn’t wait to see today’s tweets in our Verizon iPhone Tracker today. (In case you didn’t hear, there’s a
  And my favorite part:
You must be logged in to post a comment.